- Published on
Benchmark Report — 2026-03-30
- Authors
- Name
- Jun Ma
Summary
Baseline benchmark of 2 MIL models (CLAM-MB, SimpleMIL) across 3 foundation model encoders (H-Optimus-1, UNI-v2, Virchow2) on 6 tasks spanning 3 datasets (CLWD, CCRCC, HANCOCK). All experiments use 5-fold stratified cross-validation with 60/20/20 train/val/test splits. Results report mean test metrics with 95% CIs via t-distribution.
Key Findings
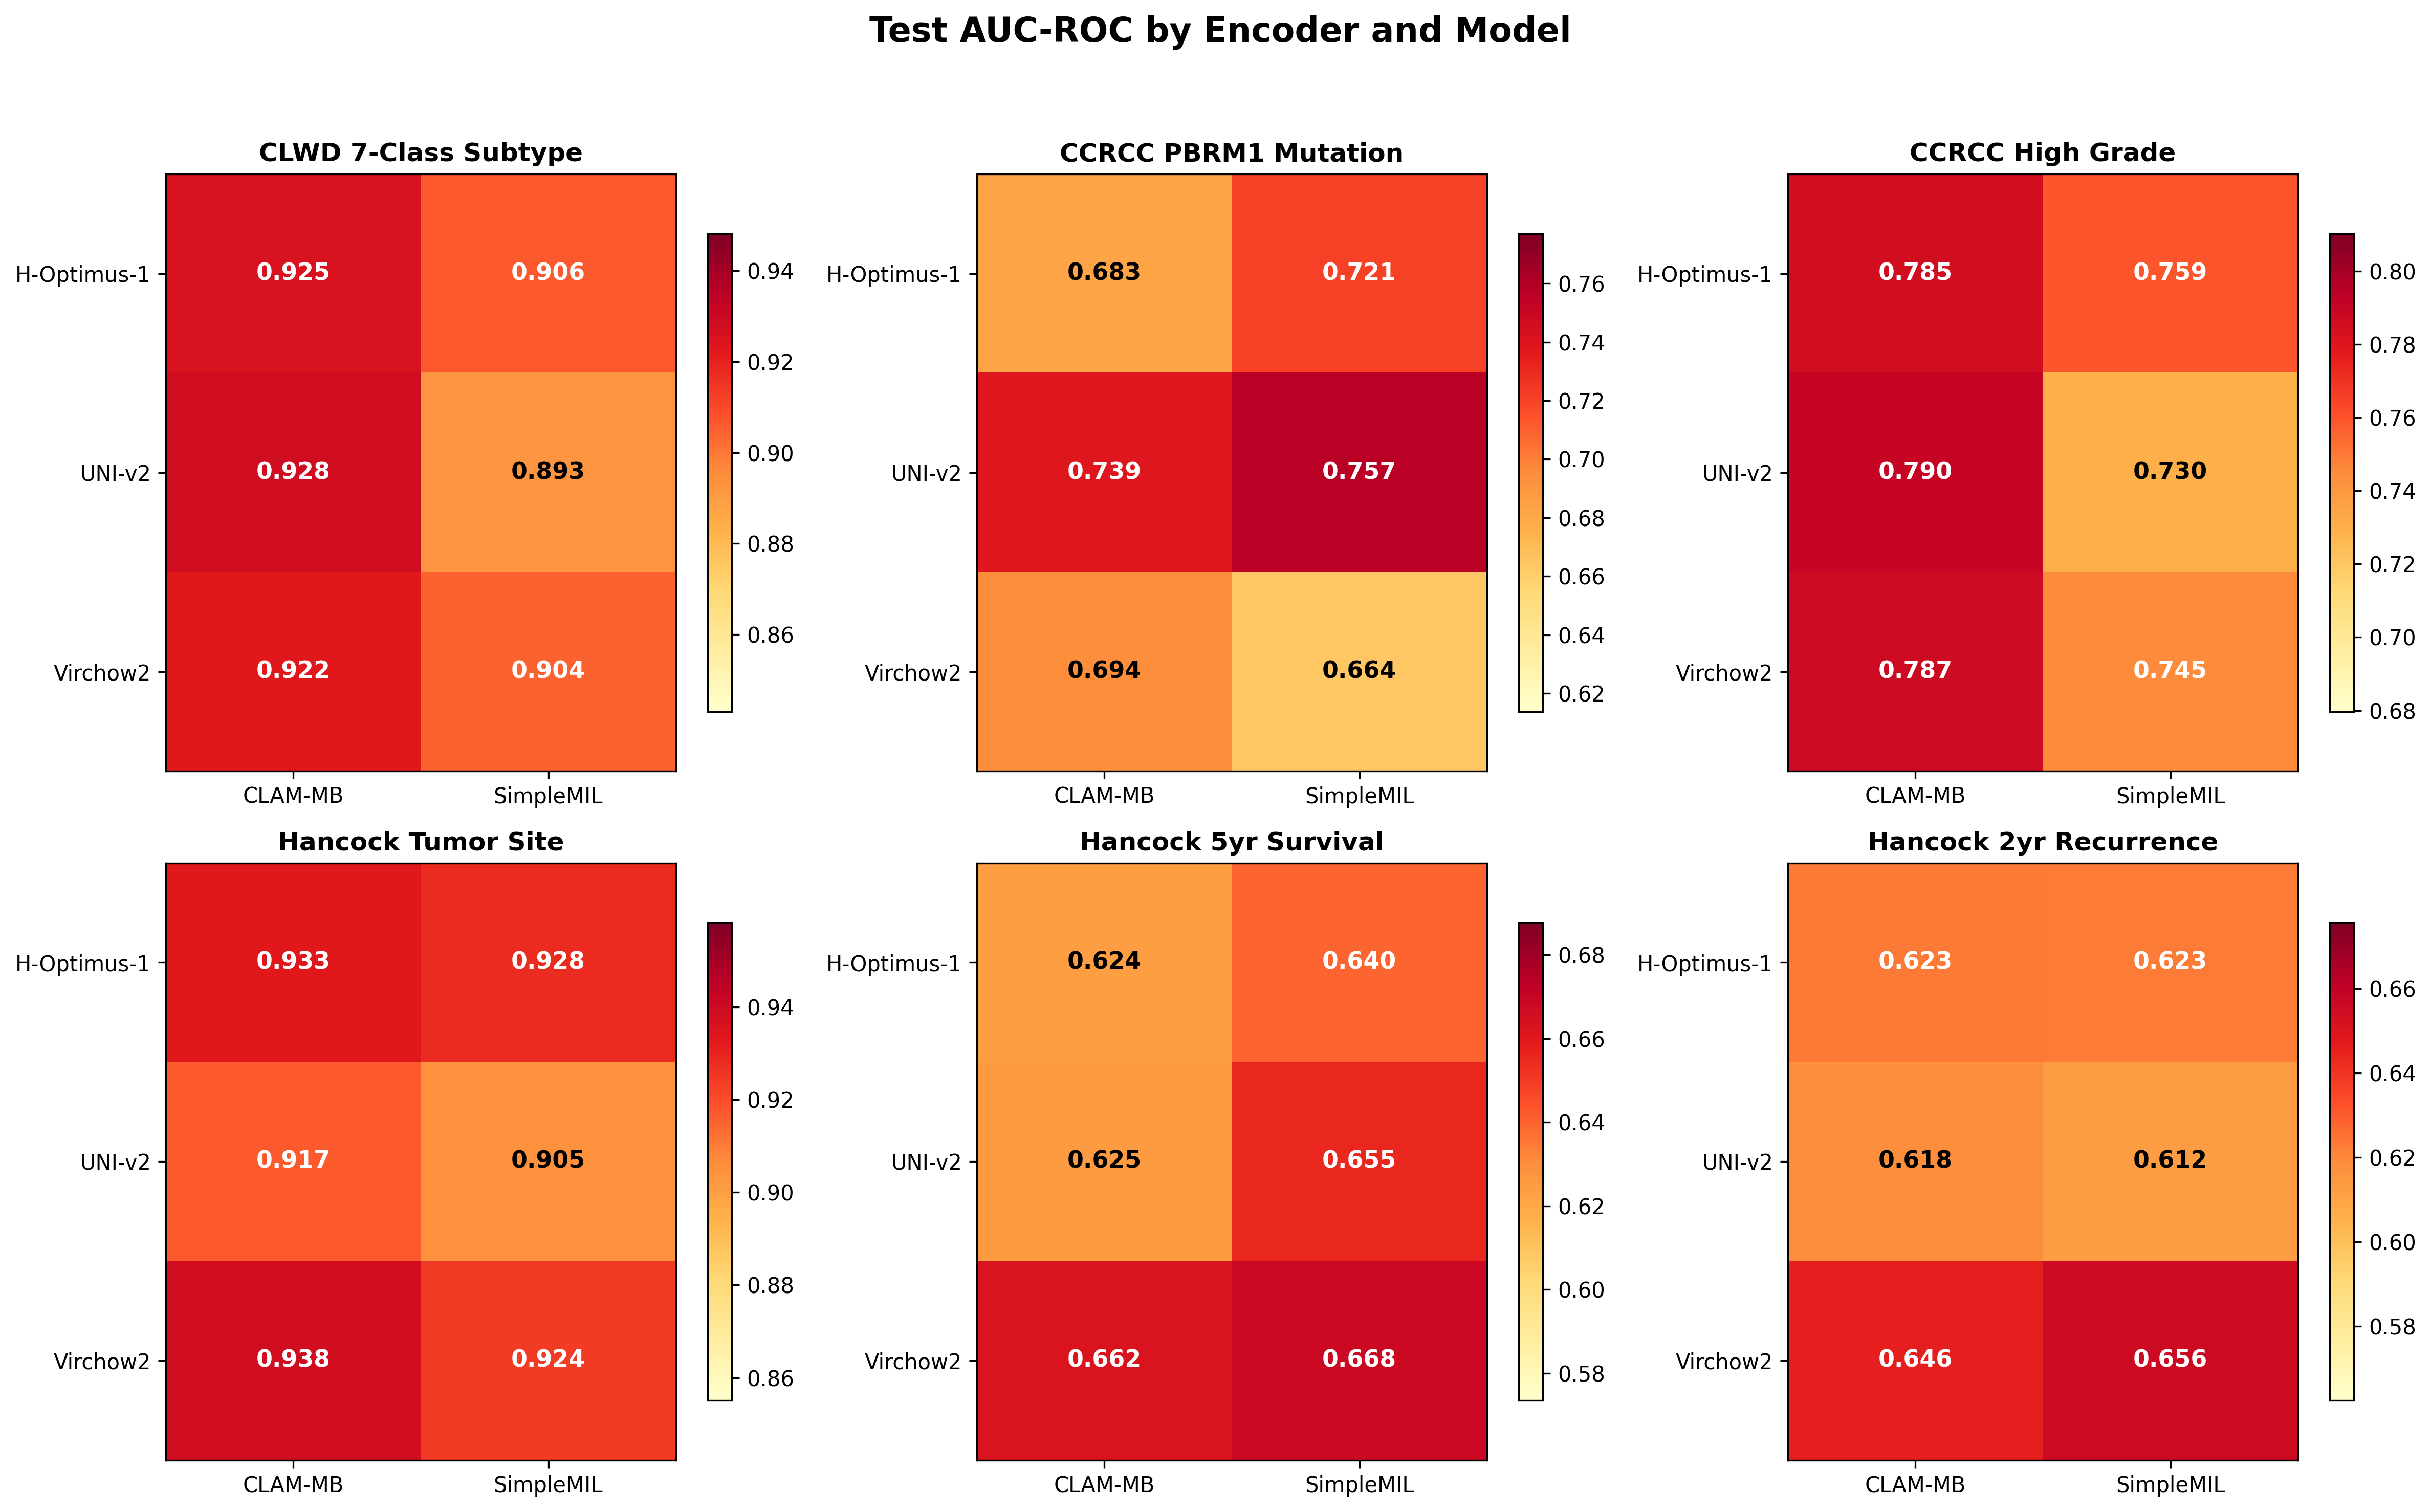
- CLWD 7-Class Subtype: Best AUC = 0.928 (CLAM-MB + UNI-v2)
- CCRCC PBRM1 Mutation: Best AUC = 0.757 (SimpleMIL + UNI-v2)
- CCRCC High Grade: Best AUC = 0.790 (CLAM-MB + UNI-v2)
- Hancock Tumor Site: Best AUC = 0.938 (CLAM-MB + Virchow2)
- Hancock 5yr Survival: Best AUC = 0.668 (SimpleMIL + Virchow2)
- Hancock 2yr Recurrence: Best AUC = 0.656 (SimpleMIL + Virchow2)
Results
CLWD 7-Class Subtype
Dataset: CLWD | Classes: 7 | Strategy: standard 5-fold CV
| Model | Encoder | Test AUC (95% CI) | Test bACC (95% CI) | Val AUC |
|---|---|---|---|---|
| CLAM-MB | UNI-v2 | 0.928 (0.913-0.944) | 0.639 (0.601-0.678) | 0.930 |
| CLAM-MB | H-Optimus-1 | 0.925 (0.905-0.946) | 0.649 (0.579-0.720) | 0.932 |
| CLAM-MB | Virchow2 | 0.922 (0.901-0.944) | 0.645 (0.584-0.706) | 0.926 |
| SimpleMIL | H-Optimus-1 | 0.906 (0.896-0.917) | 0.615 (0.587-0.644) | 0.902 |
| SimpleMIL | Virchow2 | 0.904 (0.890-0.919) | 0.598 (0.539-0.657) | 0.911 |
| SimpleMIL | UNI-v2 | 0.893 (0.863-0.924) | 0.561 (0.461-0.661) | 0.888 |
CCRCC PBRM1 Mutation
Dataset: CCRCC | Classes: 2 | Strategy: standard 5-fold CV
| Model | Encoder | Test AUC (95% CI) | Test bACC (95% CI) | Val AUC |
|---|---|---|---|---|
| SimpleMIL | UNI-v2 | 0.757 (0.677-0.837) | 0.695 (0.624-0.767) | 0.765 |
| CLAM-MB | UNI-v2 | 0.739 (0.674-0.803) | 0.685 (0.597-0.772) | 0.771 |
| SimpleMIL | H-Optimus-1 | 0.721 (0.624-0.818) | 0.669 (0.596-0.742) | 0.701 |
| CLAM-MB | Virchow2 | 0.694 (0.618-0.771) | 0.631 (0.578-0.683) | 0.699 |
| CLAM-MB | H-Optimus-1 | 0.683 (0.621-0.745) | 0.621 (0.566-0.676) | 0.692 |
| SimpleMIL | Virchow2 | 0.664 (0.585-0.743) | 0.612 (0.520-0.704) | 0.659 |
CCRCC High Grade
Dataset: CCRCC | Classes: 2 | Strategy: standard 5-fold CV
| Model | Encoder | Test AUC (95% CI) | Test bACC (95% CI) | Val AUC |
|---|---|---|---|---|
| CLAM-MB | UNI-v2 | 0.790 (0.720-0.861) | 0.698 (0.629-0.767) | 0.788 |
| CLAM-MB | Virchow2 | 0.787 (0.699-0.876) | 0.686 (0.613-0.760) | 0.747 |
| CLAM-MB | H-Optimus-1 | 0.785 (0.718-0.853) | 0.709 (0.644-0.774) | 0.780 |
| SimpleMIL | H-Optimus-1 | 0.759 (0.706-0.813) | 0.692 (0.665-0.719) | 0.727 |
| SimpleMIL | Virchow2 | 0.745 (0.683-0.807) | 0.663 (0.577-0.749) | 0.706 |
| SimpleMIL | UNI-v2 | 0.730 (0.682-0.777) | 0.681 (0.605-0.756) | 0.676 |
Hancock Tumor Site
Dataset: hancock | Classes: 4 | Strategy: standard 5-fold CV
| Model | Encoder | Test AUC (95% CI) | Test bACC (95% CI) | Val AUC |
|---|---|---|---|---|
| CLAM-MB | Virchow2 | 0.938 (0.926-0.950) | 0.766 (0.724-0.809) | 0.934 |
| CLAM-MB | H-Optimus-1 | 0.933 (0.905-0.961) | 0.759 (0.725-0.793) | 0.938 |
| SimpleMIL | H-Optimus-1 | 0.928 (0.891-0.965) | 0.773 (0.717-0.829) | 0.924 |
| SimpleMIL | Virchow2 | 0.924 (0.887-0.961) | 0.761 (0.694-0.829) | 0.922 |
| CLAM-MB | UNI-v2 | 0.917 (0.887-0.947) | 0.717 (0.683-0.751) | 0.920 |
| SimpleMIL | UNI-v2 | 0.905 (0.880-0.930) | 0.713 (0.680-0.745) | 0.899 |
Hancock 5yr Survival
Dataset: hancock | Classes: 2 | Strategy: standard 5-fold CV
| Model | Encoder | Test AUC (95% CI) | Test bACC (95% CI) | Val AUC |
|---|---|---|---|---|
| SimpleMIL | Virchow2 | 0.668 (0.599-0.736) | 0.616 (0.574-0.658) | 0.670 |
| CLAM-MB | Virchow2 | 0.662 (0.601-0.723) | 0.576 (0.494-0.657) | 0.661 |
| SimpleMIL | UNI-v2 | 0.655 (0.596-0.714) | 0.615 (0.578-0.652) | 0.646 |
| SimpleMIL | H-Optimus-1 | 0.640 (0.608-0.672) | 0.598 (0.569-0.627) | 0.662 |
| CLAM-MB | UNI-v2 | 0.625 (0.559-0.691) | 0.575 (0.533-0.618) | 0.654 |
| CLAM-MB | H-Optimus-1 | 0.624 (0.579-0.668) | 0.578 (0.526-0.629) | 0.631 |
Hancock 2yr Recurrence
Dataset: hancock | Classes: 2 | Strategy: standard 5-fold CV
| Model | Encoder | Test AUC (95% CI) | Test bACC (95% CI) | Val AUC |
|---|---|---|---|---|
| SimpleMIL | Virchow2 | 0.656 (0.607-0.704) | 0.607 (0.582-0.632) | 0.643 |
| CLAM-MB | Virchow2 | 0.646 (0.595-0.697) | 0.571 (0.531-0.612) | 0.647 |
| CLAM-MB | H-Optimus-1 | 0.623 (0.551-0.695) | 0.579 (0.534-0.625) | 0.626 |
| SimpleMIL | H-Optimus-1 | 0.623 (0.571-0.674) | 0.590 (0.550-0.630) | 0.643 |
| CLAM-MB | UNI-v2 | 0.618 (0.539-0.698) | 0.584 (0.519-0.649) | 0.624 |
| SimpleMIL | UNI-v2 | 0.612 (0.518-0.707) | 0.576 (0.536-0.616) | 0.633 |
Figures
Test AUC-ROC Heatmaps (Encoder x Model)
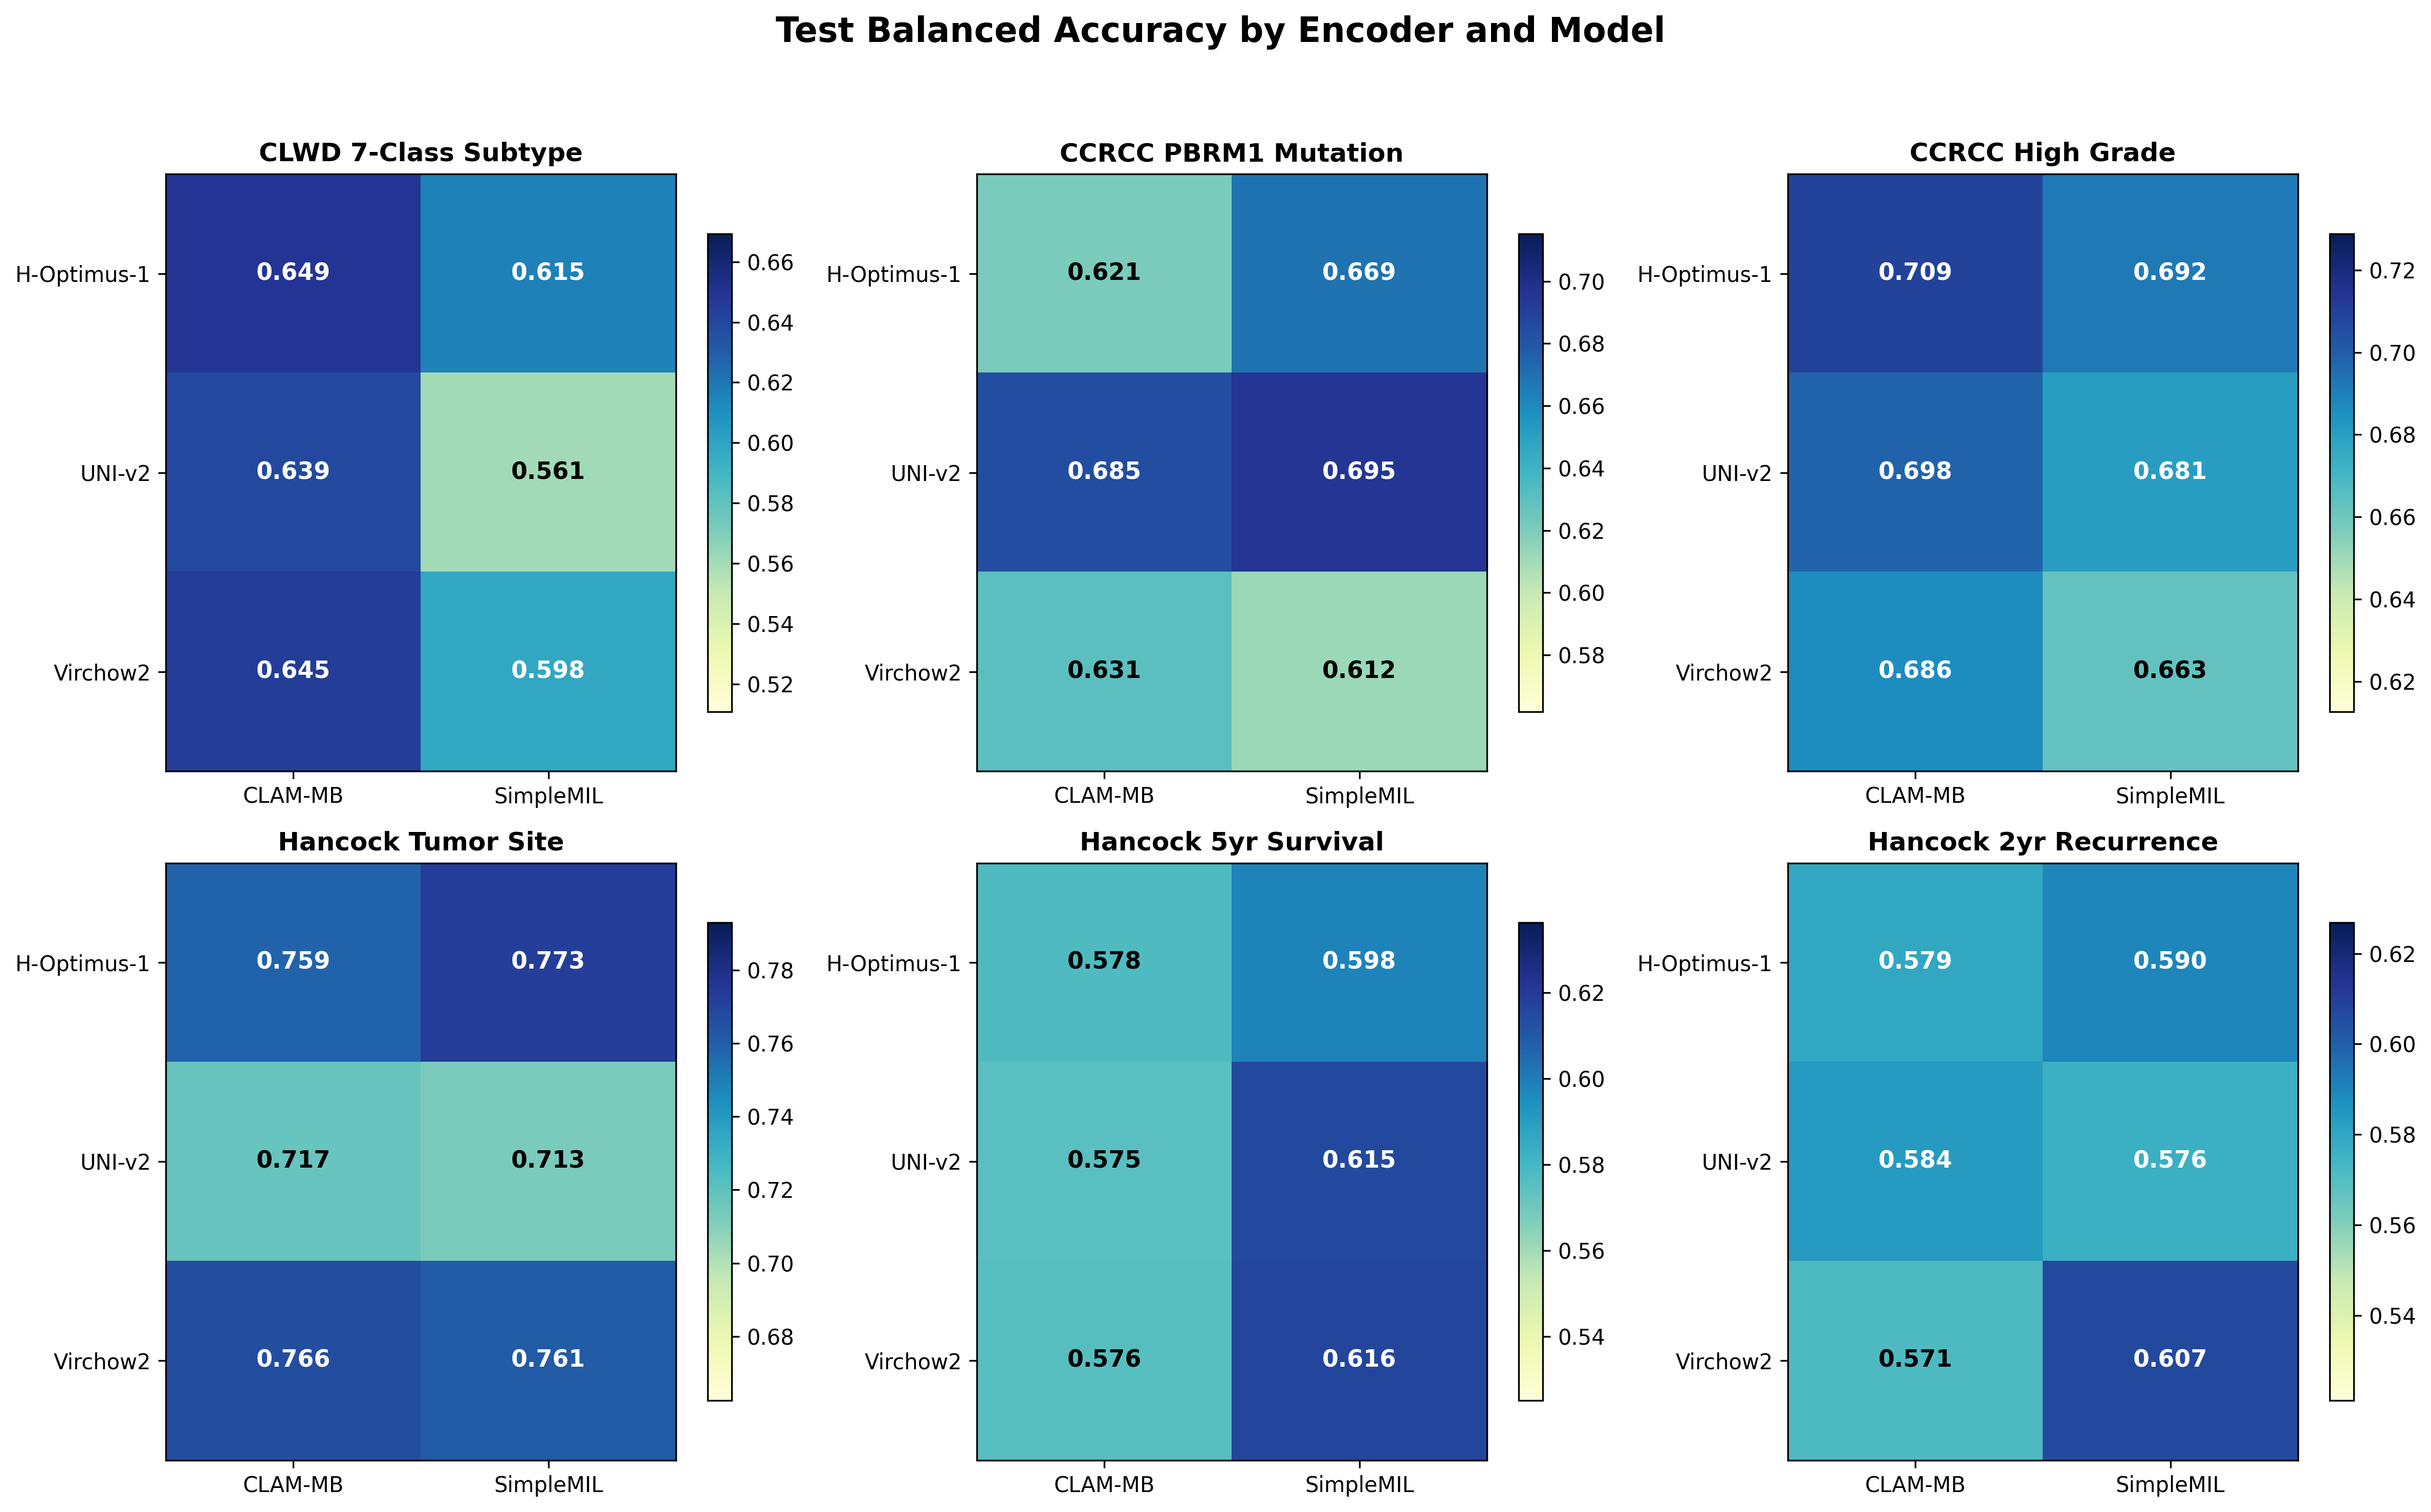
Test Balanced Accuracy Heatmaps
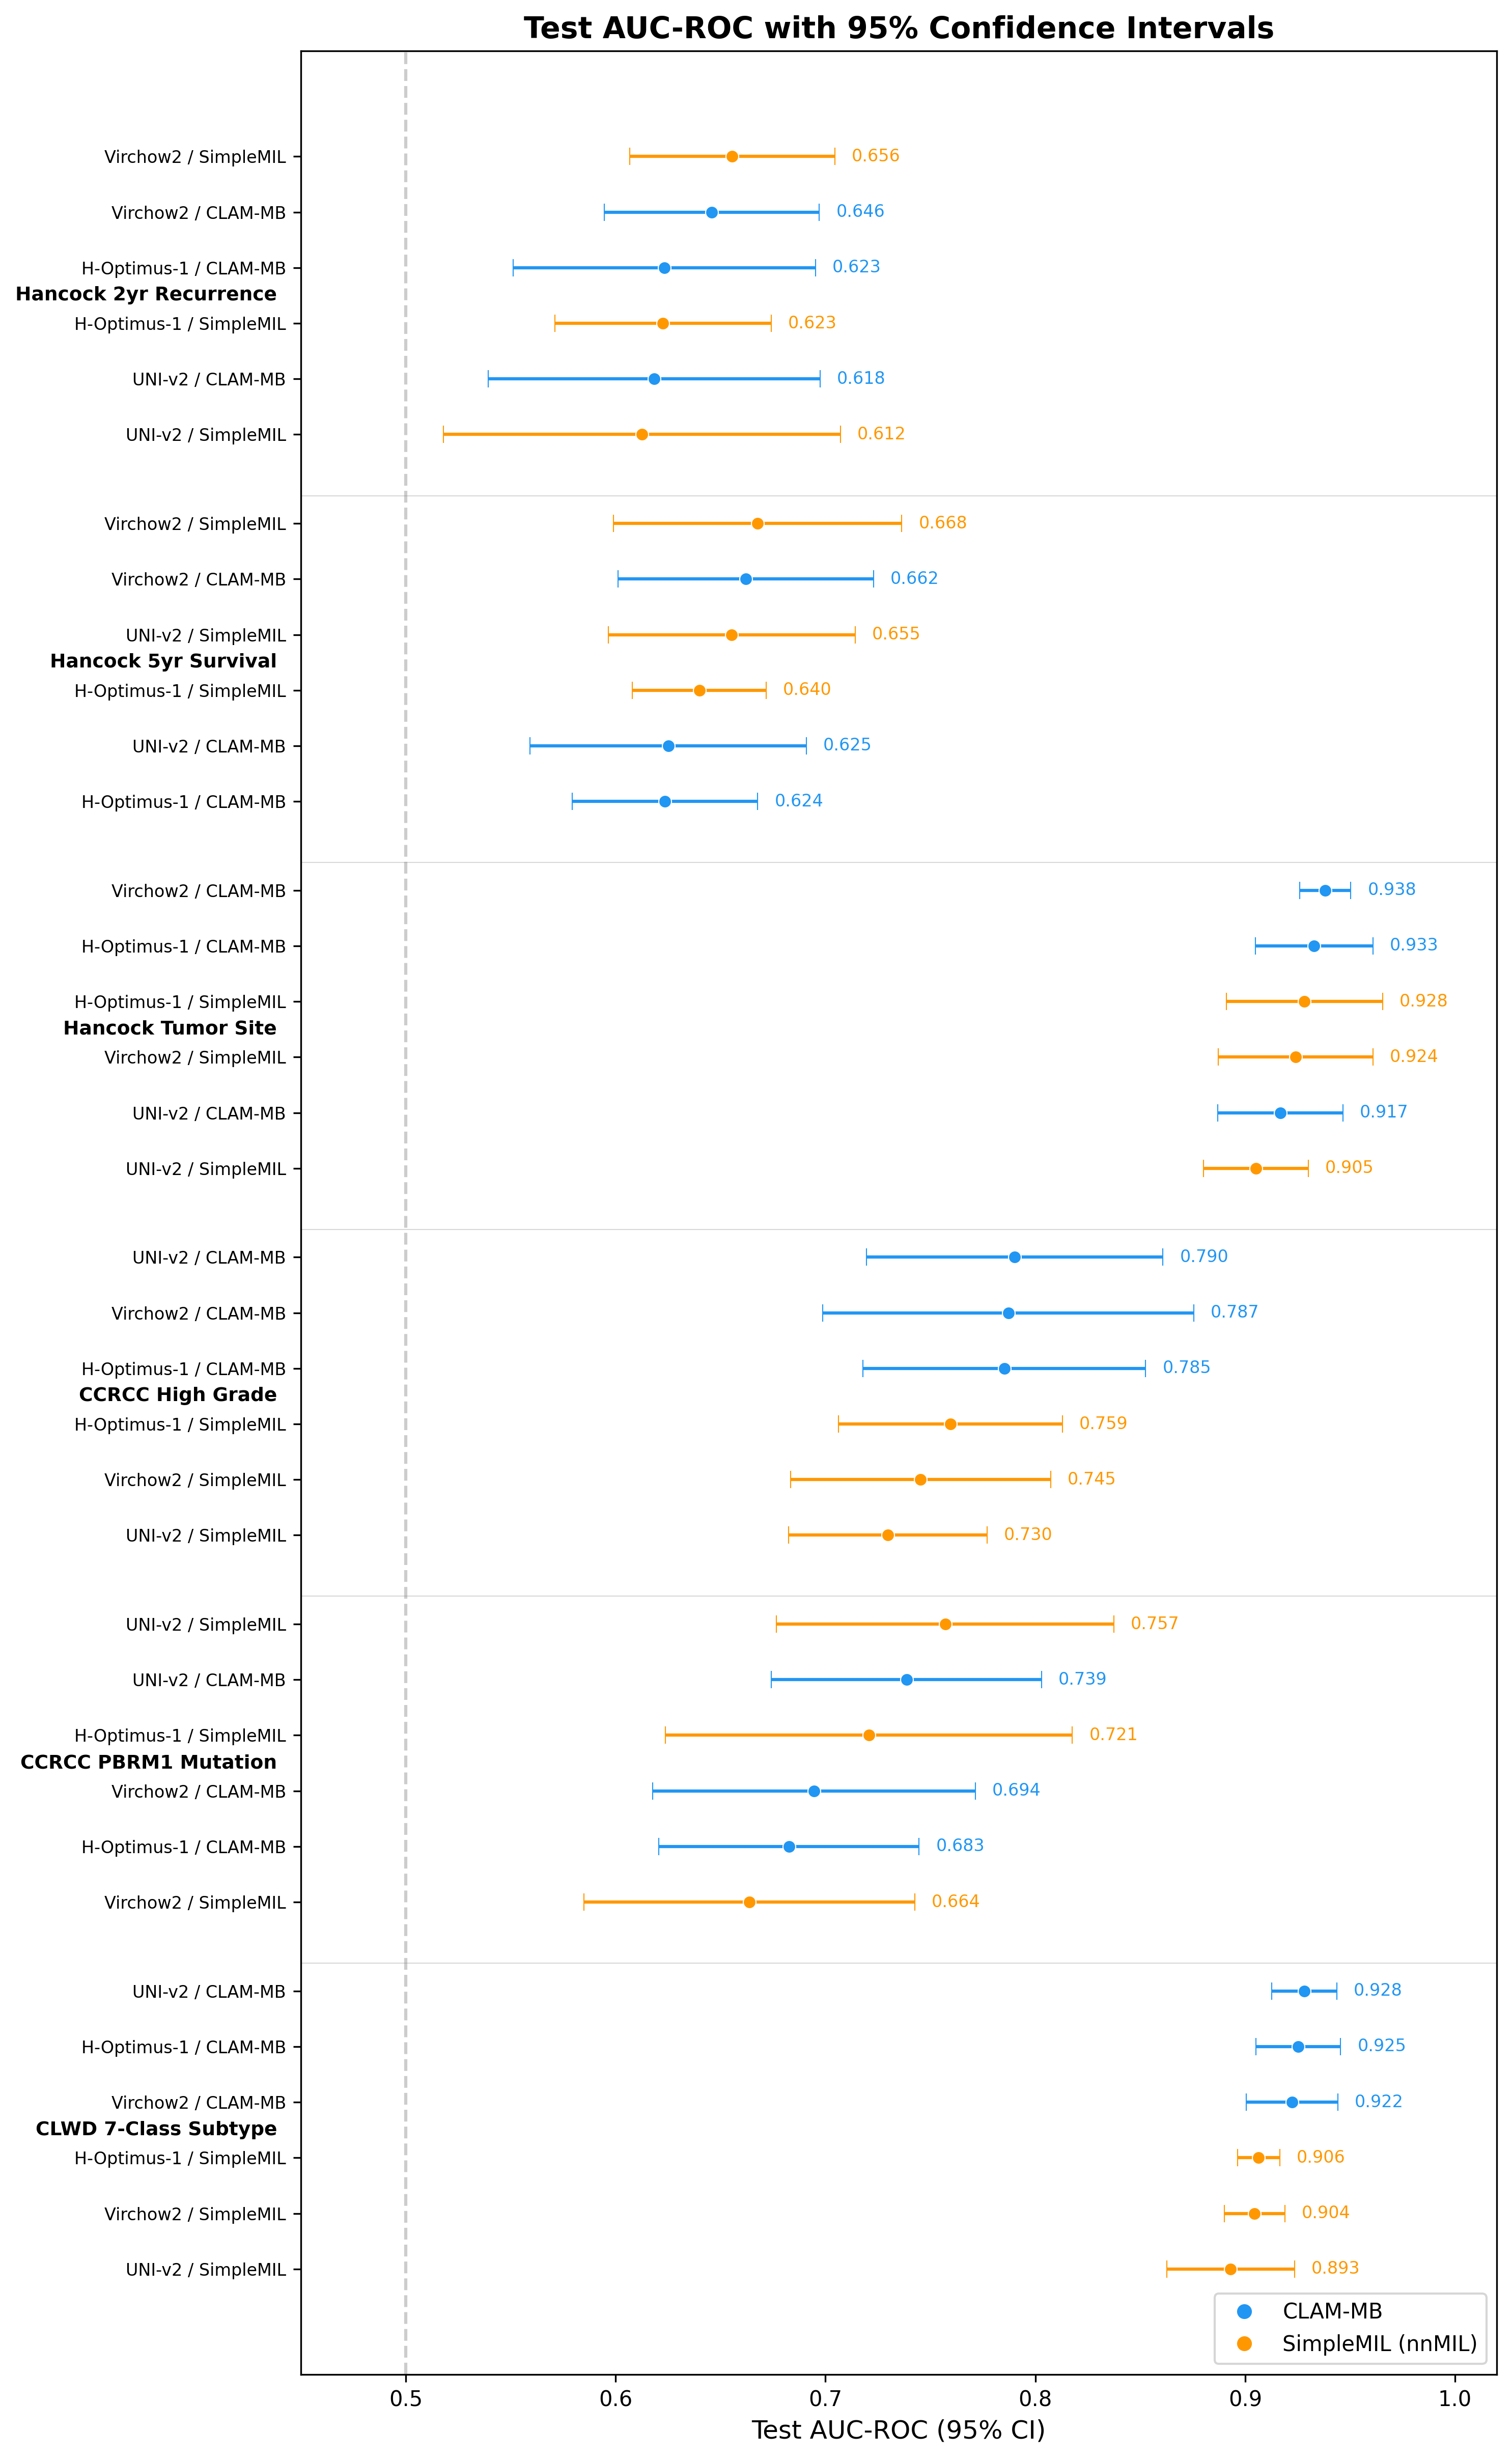
Forest Plot — AUC with 95% CIs
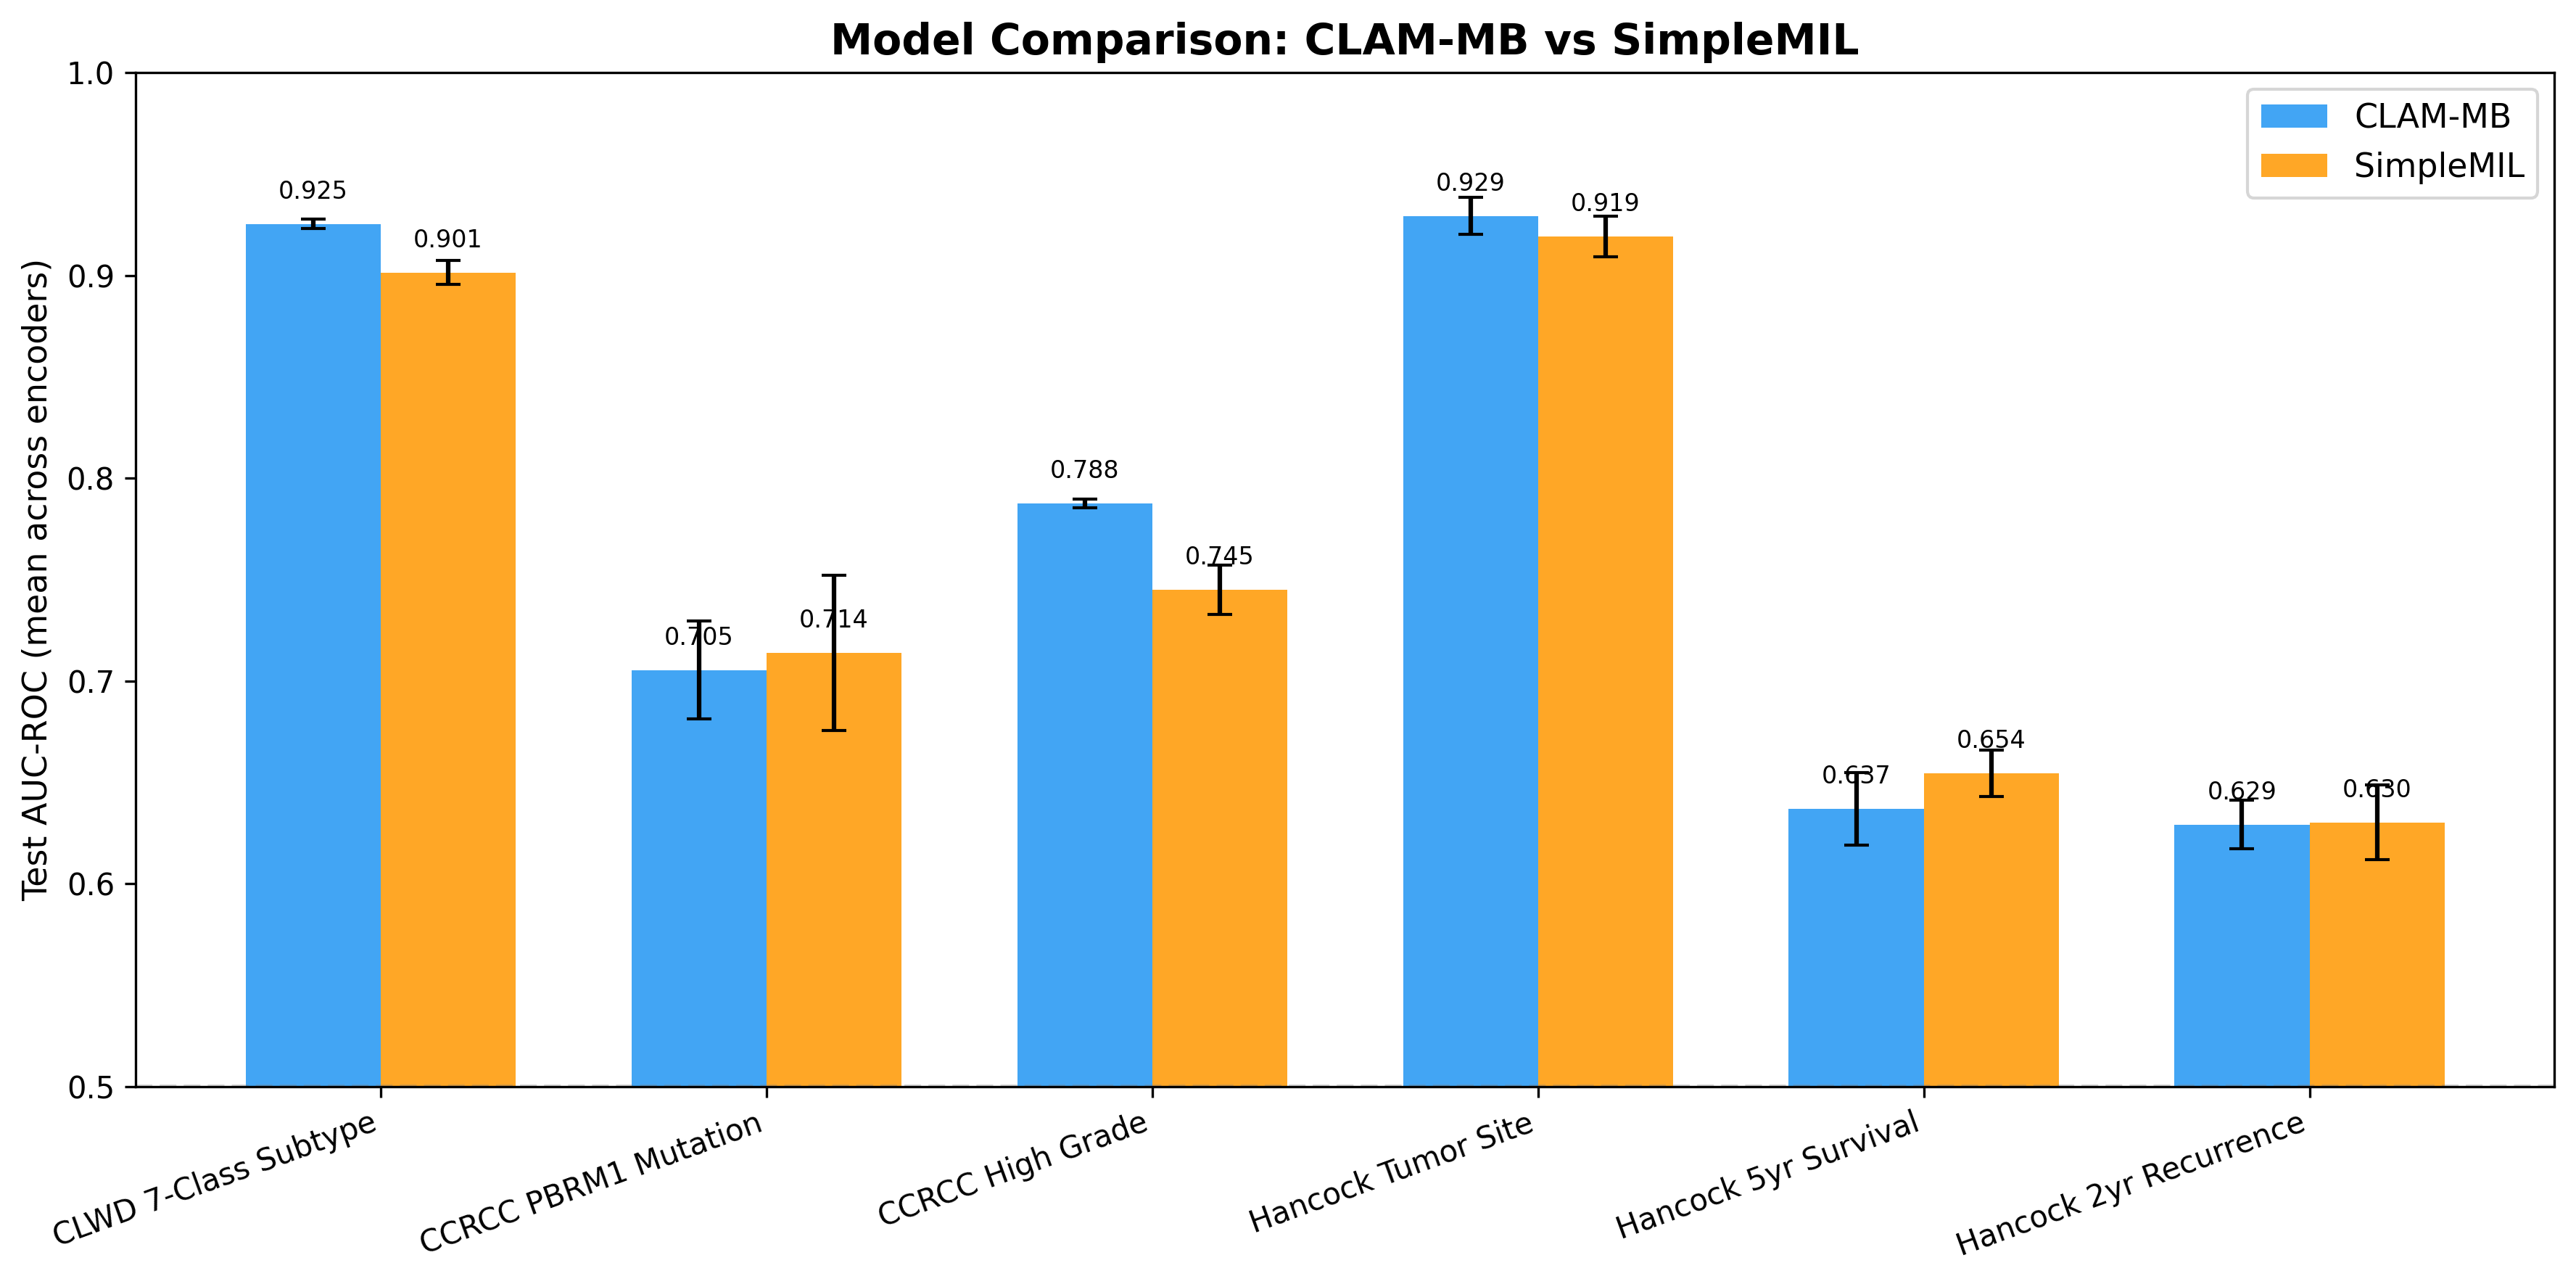
Model Comparison (CLAM-MB vs SimpleMIL)
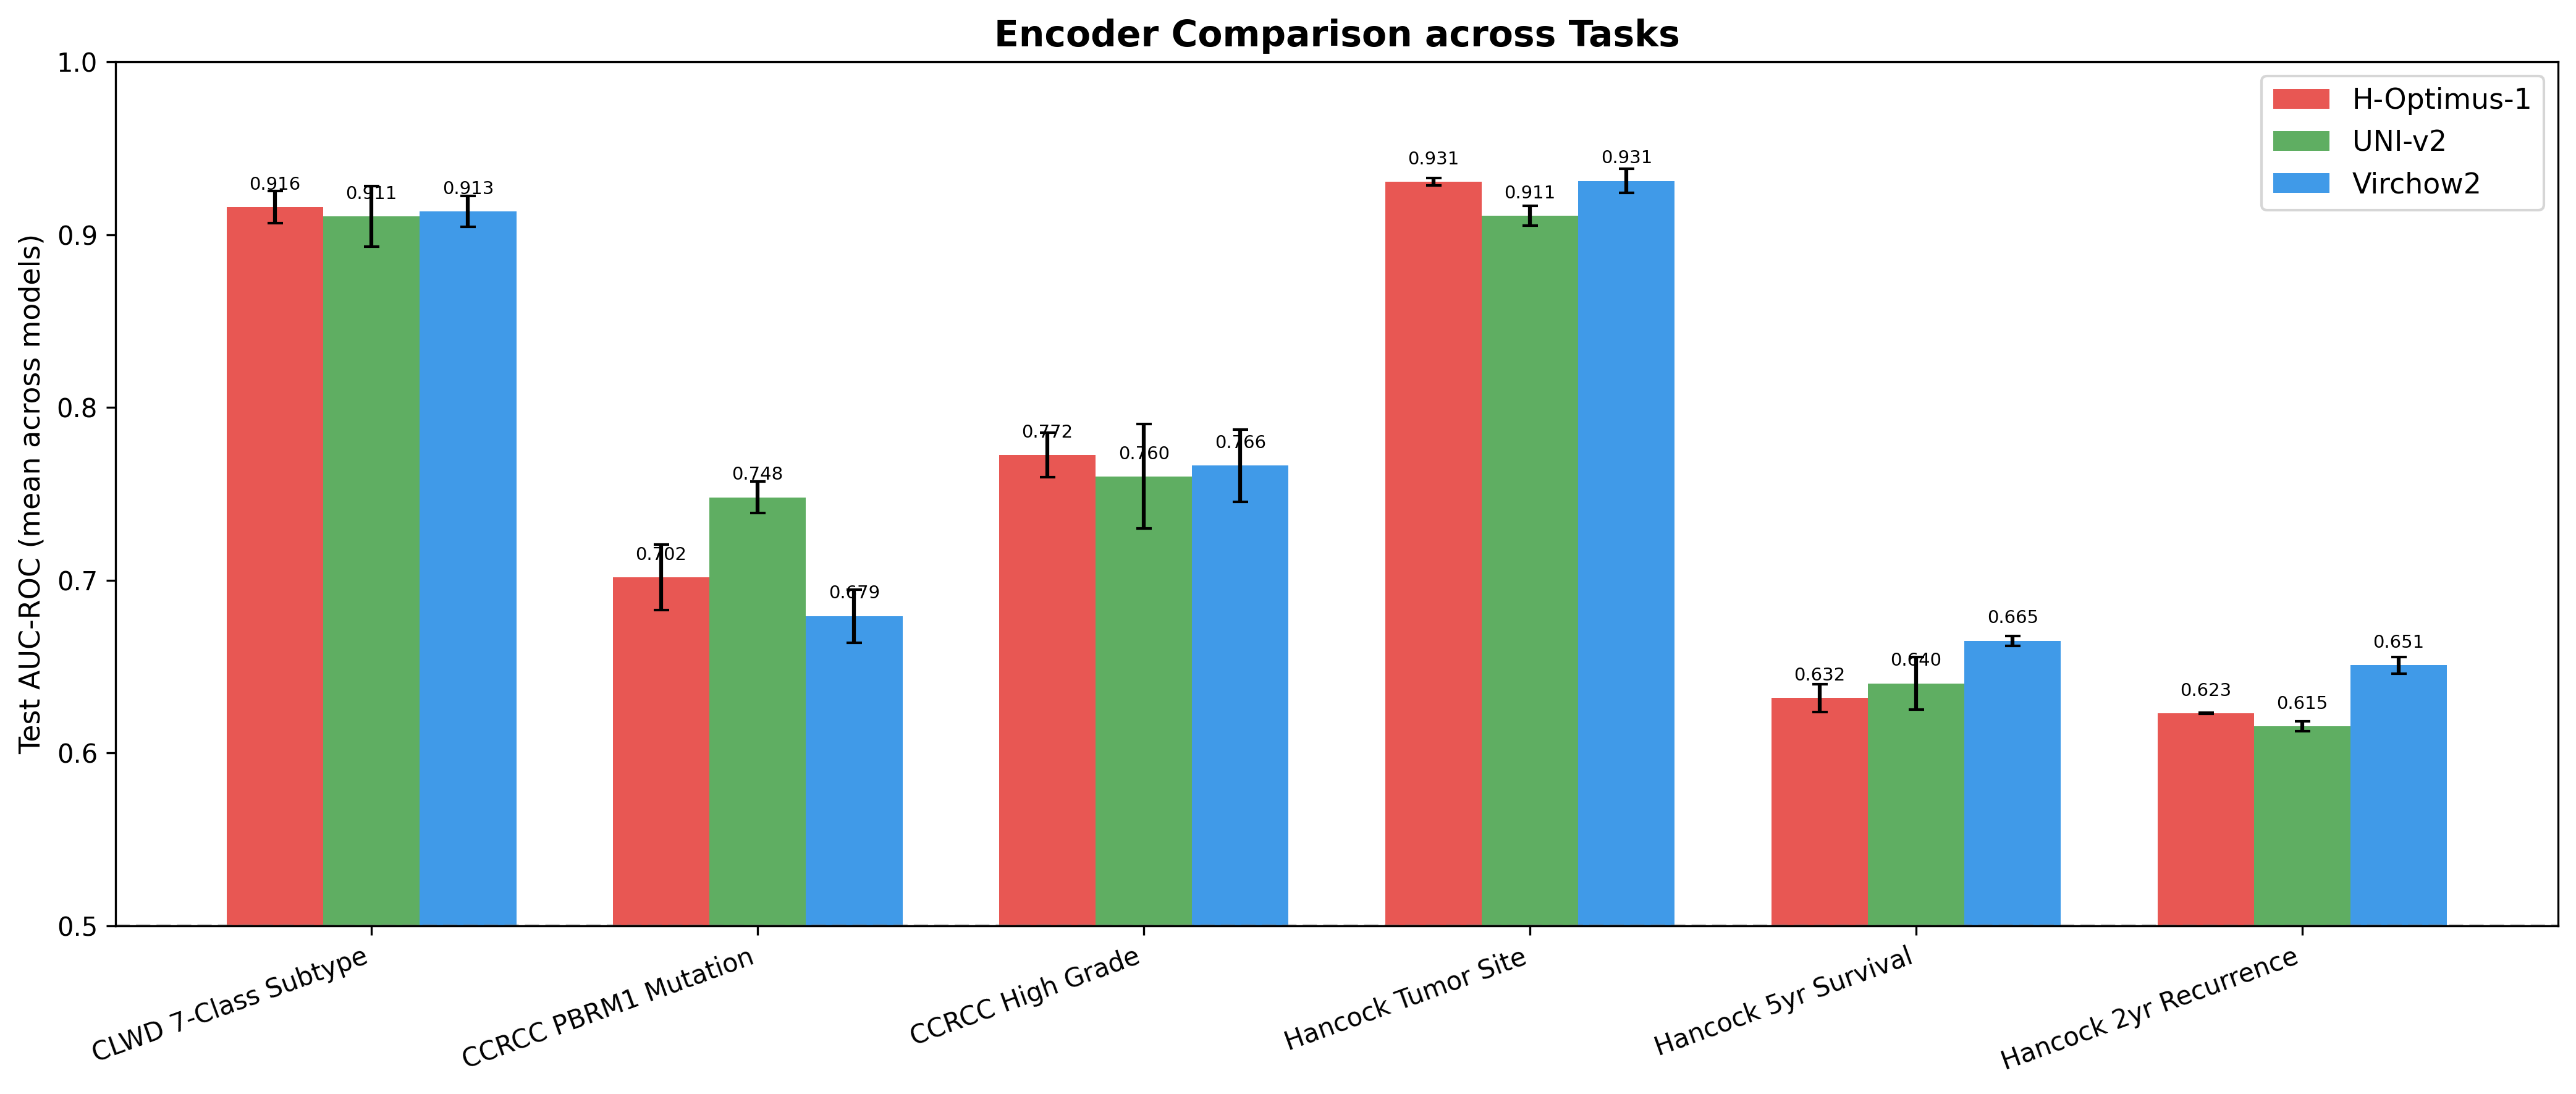
Encoder Comparison
Conclusions
- Model comparison: CLAM-MB achieves slightly higher average AUC (CLAM-MB: 0.769, SimpleMIL: 0.761) across all tasks and encoders, though differences are within confidence intervals on most tasks.
- Encoder comparison: Virchow2 achieves the highest average AUC (0.768), followed by UNI-v2 (0.764), H-Optimus-1 (0.763).
- Task difficulty: Hancock Tumor Site is the easiest task (avg AUC 0.924), while Hancock 2yr Recurrence is the hardest (avg AUC 0.630). Survival and treatment outcome tasks show modest but above-chance signal from H&E alone, consistent with literature expectations for WSI-only prediction.
- autoMIL opportunity: These baselines establish the starting point for autoMIL's iterative improvement loop. Tasks with moderate AUC (0.6-0.8) — particularly PBRM1 mutation prediction, survival, and treatment outcome — offer the most headroom for model architecture search and hyperparameter optimization.
Generated by autobench reporting pipeline